Further Analysis and Visualization Guides
Here we give some instructions for further analysis of the valid RNA-DNA interaction map.
Simple Statistics Report
When you got the processed RNA-DNA interaction data in .pairs format, you definitely want to know some basic data
statistics, such as number of intra- and inter-chromosomal interactions. We provide imargi_stats.sh to generate a
simple text data statistics report. The example command is:
docker run --rm -t -u 1043 -v ~/imargi_example:/imargi zhonglab/imargi imargi_stats.sh \
    -D 5end \
    -d 200000 \
    -i ./output/final_HEK_iMARGI.pairs.gz \
    -o ./output/report_final_HEK_iMARGI.txt
The -d argument sets the genomic distance threshold of defining proximal and distal interactions (intra-chromosomal).
It will report the number of proximal and distal interactions. Besides, you can set a list of values separated with ,,
such as -d 1000,2000,10000,20000,200000,1000000, then the report will include the statistics number with different
thresholds (space is not allowed). The distance is directly calculated based on the mapped 5’ end position (default
is -D 5end). You can use -D outer or -D inner argument to set using the distance of farthest or nearest ends of
mapped read pair, respectively. When use -D outer or -D inner, the tool will use the extra cigar information in
the .pairs data.
The generated report includes these statistics:
- Total number of RNA-DNA interactions
- Number of inter-chromosomal interactions
- Number of intra-chromosomal interactions
- Number of distal and proximal intra-chromosomal interactions
Distance Filtering of Pairs
In the intra-chromosomal interactions, the most majority are short-range (proximal) interactions, which likely represent
interactions between nascent transcripts and their neighboring genomic sequences. We usually filter out those proximal
interactions with a distance threshold, which depends on the requirements of further analysis. We provide
imargi_distfilter.sh tool for filtering interaction based on interaction genomic distance. The example command is:
docker run --rm -t -u 1043 -v ~/imargi_example:/imargi zhonglab/imargi imargi_distfilter.sh \
    -D 5end \
    -d 20000 \
    -i ./output/final_HEK_iMARGI.pairs.gz \
    -o ./output/filter20k_final_HEK_iMARGI.pairs.gz
The command will filter out those intra-chromosomal interactions with genomic distance less than 200,000 (-d 200000).
The distance is directly calculated based on the mapped 5’ end position (default is -D 5end). You can use-D outer or
-D inner argument to set using the distance of farthest or nearest ends of read pair, respectively. When use
-D outer or -D inner, the tool will use the extra cigar information in the .pairs data.
Annotation of Genomic Features
Annotating RNA-ends and DNA-ends with genomic features are valuable for investigation the biological meanings of
RNA-DNA interactions. Using imargi_annotate.sh, users can annotate both RNA and DNA ends with gene annotations in
GTF/GFF format or any other genomic features in a simple BED file (each line is a named genomic feature). The example
command below will generate two new gene annotation columns named as gene1 and gene2 in the output .pairs format file.
docker run --rm -t -u 1043 -v ~/imargi_example:/imargi zhonglab/imargi imargi_annotate.sh \
    -A gtf \
    -a ./ref/gencode.v24.annotation.gtf \
    -l gene \
    -f gene_id,gene_name,gene_type \
    -C both \
    -c gene1,gene2 \
    -s rn \
    -m 1,1 \
    -G cigar1,cigar2 \
    -i ./output/final_HEK_iMARGI.pairs.gz \
    -o ./output/annot_final_HEK_iMARGI.pairs.gz
There are several important arguments you can use to customize your annotation.
-A: Only accept-A gtffor annotating gene with GTF file or-A bedfor annotating any other genomic features in a simple BED format file. Default is-A gtf.-agive the annotation information file.-l: Annotation level for GTF file. GTF file has different level information, such as exon and gene body. The default is annotate based on gene body genomic coordinates,-l gene. If you want to strictly annotate, then use-l exonmode.-C: Determine Which end to be annotated. It accepts-C RNA,-C DNAor-C both. Default is-C both, then both RNA and DNA ends will be annotated. The lowercase-cargument give the names of annotation column in the output file. If-C both, then you need set two column names separated with comma,, i.e.,-c gene1,gene2. Space is not allowed. Don’t use the 18 reserved column names to name the annotation columns.-f: annotation feature attributes for GTF file (-A gtf). You can set it based on your GTF file content. Default is-f gene_id,gene_name,gene_type.-s: Strand specific option. The RNA end of iMARGI is reverse-strand-specific, so we annotate its gene locus using its reverse strand.’s’ means strand specific, ‘r’ means reverse-strand-specific, and ‘n’ means none strand specific, ignoring it. So the default is-s rn.-m: Minimum bases of overlapping for annotation.-m 1means at least one base overlapping.-m 0means it must be inside of the genomic feature. If annotate both ends with-C both, then you need two values for-mseparated by comma,, such as-m 1,1.-G: cigar information used for annotation. If you only want to annotate based on default position reported in .pairs file, i.e., 5’ end genomic coordinate, then set-G false,false. Default is-G cigar1,cigar2.
Data Format Conversion
For further analysis and visualization, other formats instead of .pairs format might be needed. We provide
imargi_convert.sh for converting formats. It can convert .pairs format to BEDPE, .cool and GIVE interaction format
with different -f argument options. The example command is below:
docker run --rm -t -u 1043 -v ~/imargi_example:/imargi zhonglab/imargi imargi_convert.sh \
    -f bedpe \
    -i ./output/final_HEK_iMARGI.pairs.gz \
    -o ./output/final_HEK_iMARGI.bedpe.gz
The command will generate a new BEDPE format file from original .pairs format file. By default, it will drop all the
extra information columns when convert to BEDPE format. You can use -k argument with column names separated by
comma ,, such as -k cigar1,cigar2, to keep these columns in the output BEDPE file.
If you change -f bedpe to -f cool or -f give, it will generate .cool/.mcool format or GIVE interaction format
file, respectively, which can be used by HiGlass and GIVE for visualization. With -f cool, it will output both
single resolution .cool file and multi-resolution .mcool file. The .mcool file can be used by HiGlass.
Visualization
There are multiple ways for visualization of RNA-DNA interactions. Here we suggest two interactive visualization software, HiGlass and GIVE.
HiGlass
HiGlass supports an interactive heatmap visualization of .cool file. So you just need to use imargi_convert.sh to
convert .pairs file to .cool/.mcool file.
Please read the HiGlass documentation to know how to use it. Besides, there
is an Jupyter Notebook version of HiGlass, jupyter-higlass.
Note: In the iMARGI .pairs file, coordinate of RNA is c1:p1 and coordinate of DNA is c2:p2. We can directly
generate .mcool file for HiGlass using imargi_convert.sh script. When HiGlass rendering the heatmap view from the
.mcool file, it uses a X-Y coordinates system, where X is c1:p1 and Y is c2:p2, so it will show a heatmap of
DNA x RNA matrix, i.e., row is DNA and column is RNA (such as the figure below). Currently, if you want to transpose it,
you have to generate a transposed .mcool file. Set -T true when you use imargi_convert.sh script. The HiGlass team
will add “customizable transpose” function to its control panel in next update version, then you won’t need to care
about this.
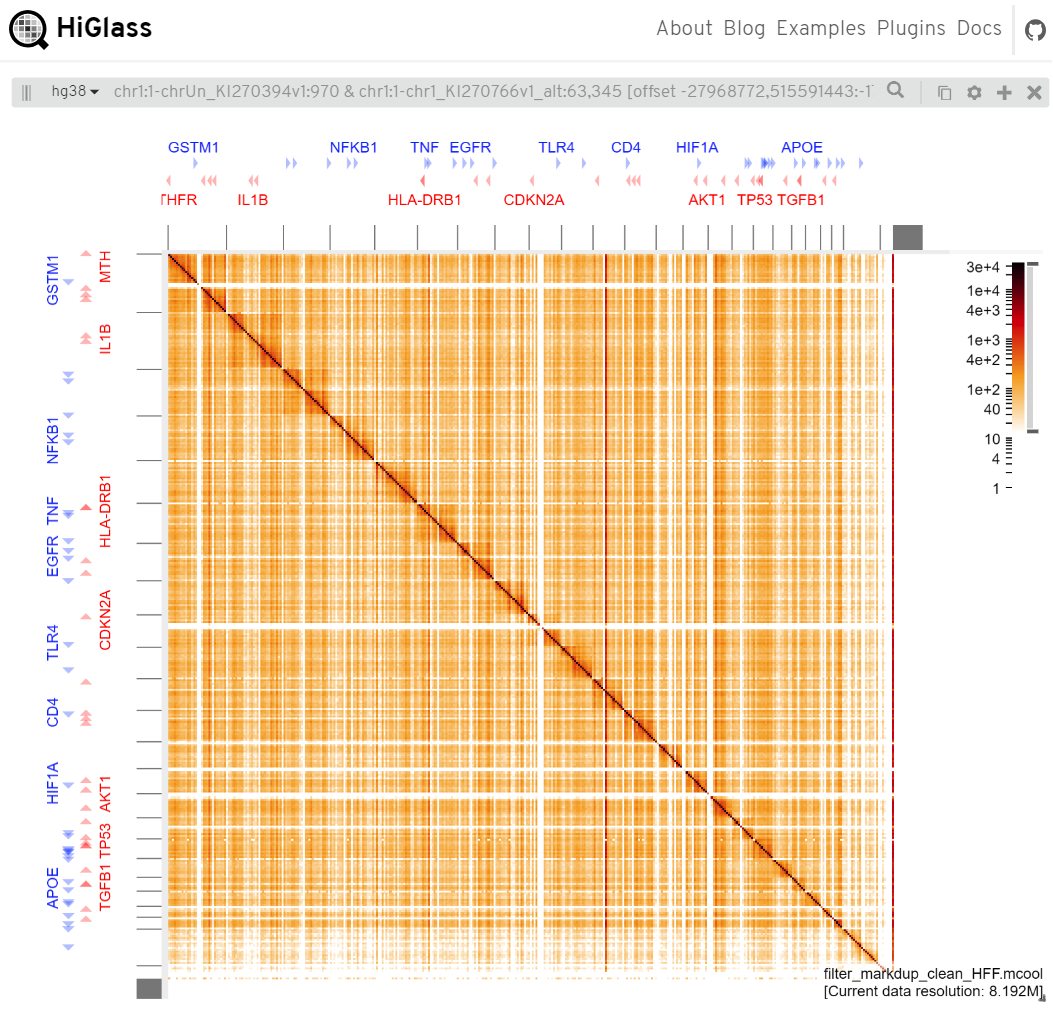 HiGLass view (row is DNA and column is RNA)
GIVE
GIVE uses links between two traditional linear genome tracks to represents genomic interactions. We just need to use
imargi_convert.sh to convert the .pairs format file to GIVE interaction format file. Please read the
GIVE tutorial to
learn how to use it.
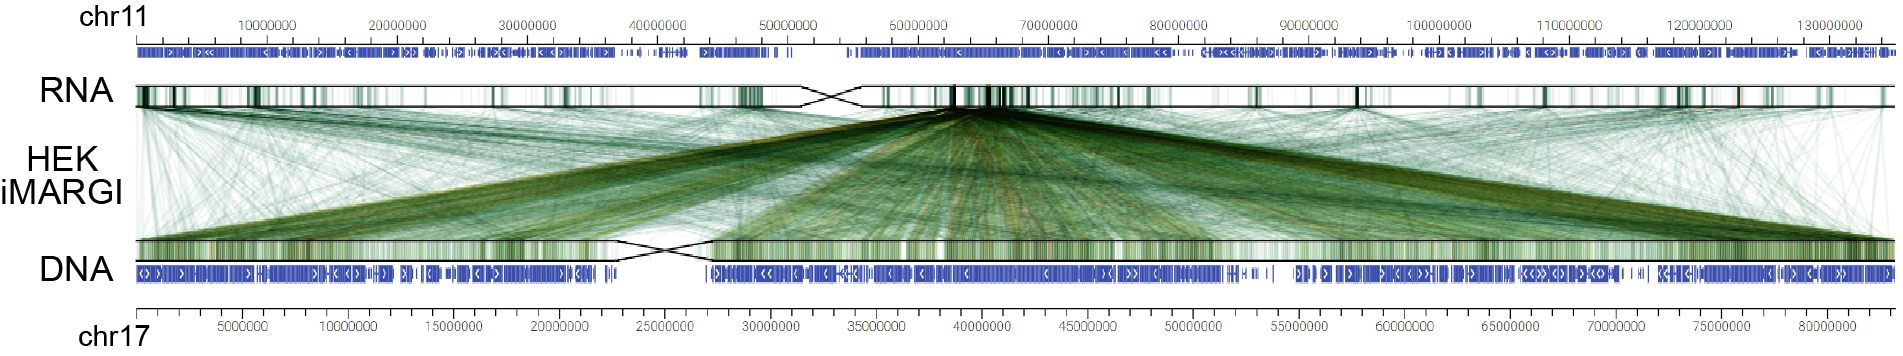 GIVE view