Overview
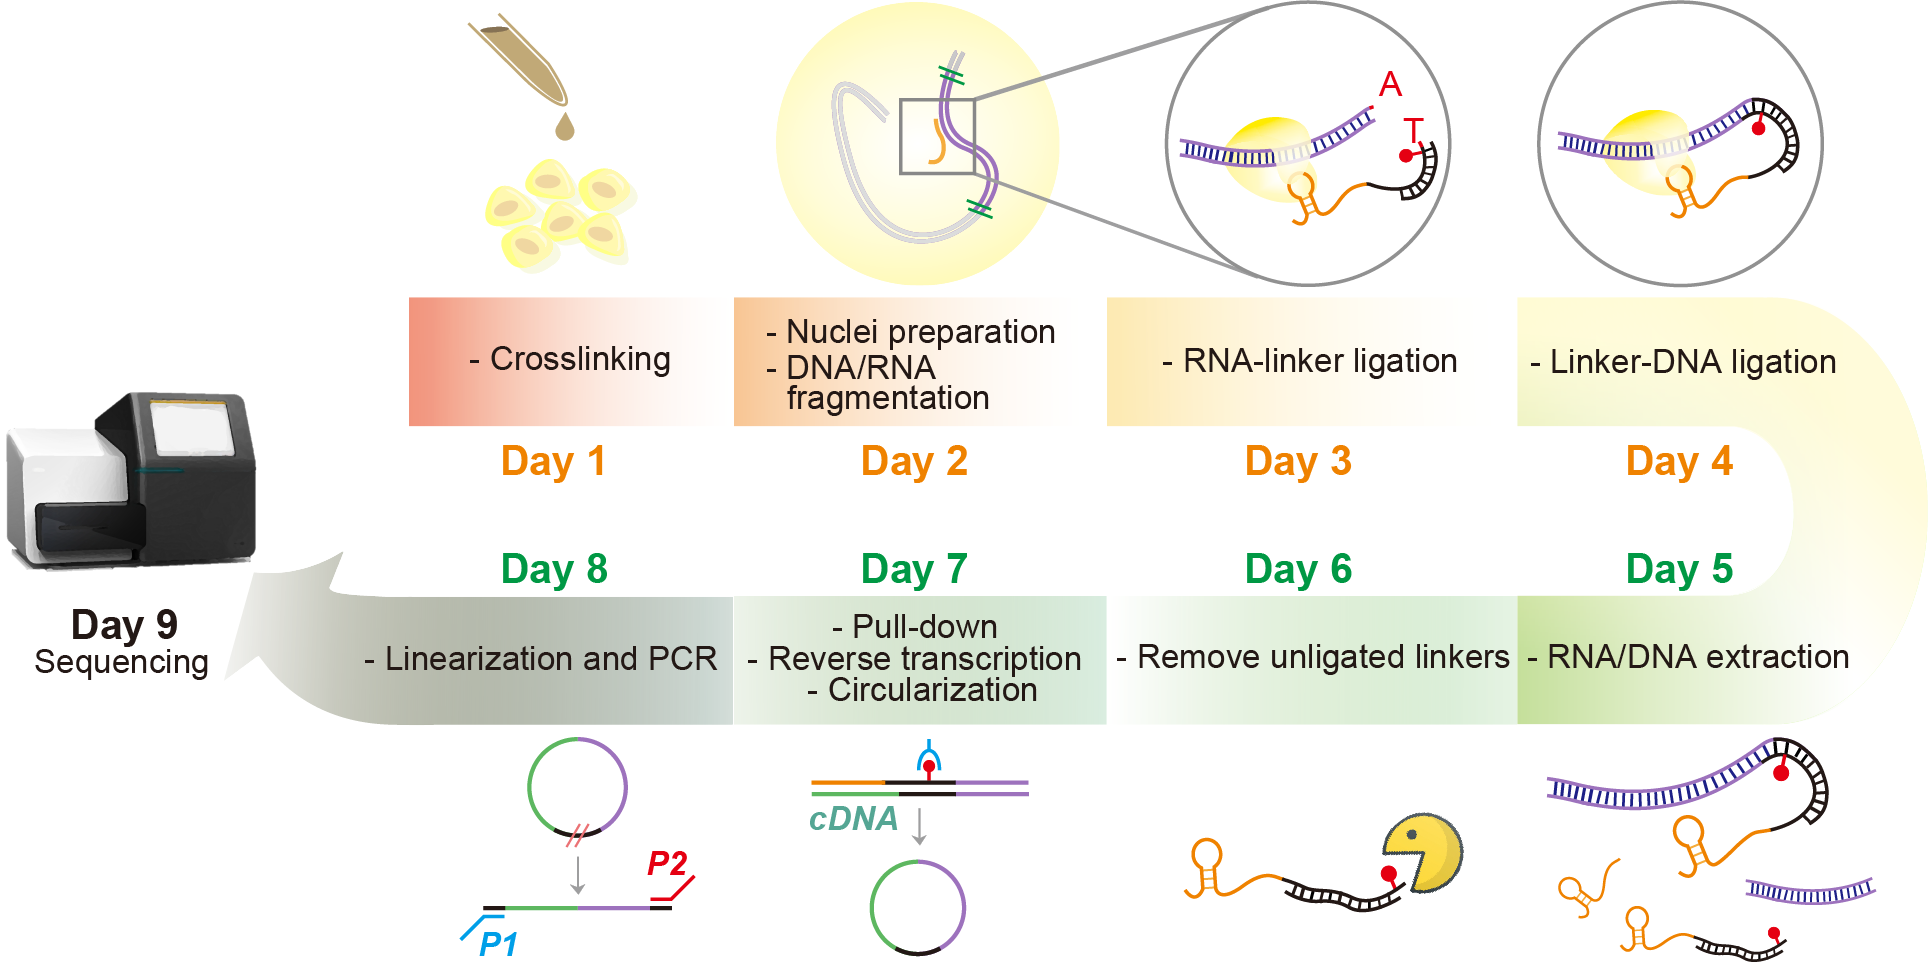
Chromatin associated RNAs (caRNAs) are proposed as a new layer of the epigenome. Interactions of caRNAs with chromatin are essential for diverse molecular and cellular functions. To genome-wide determine the potential genomic interaction loci of caRNAs, we developed MARGI (MApping RNA-Genome Interactions) [1] technique as well as its improved version called in situ MARGI (iMARGI) [2][3]. Comparing to MARGI, iMARGI carries out the ligation steps in the nuclei instead of in solution. As a result, iMARGI requires much fewer cells for the experiment while obtaining more informative sequencing read pairs.
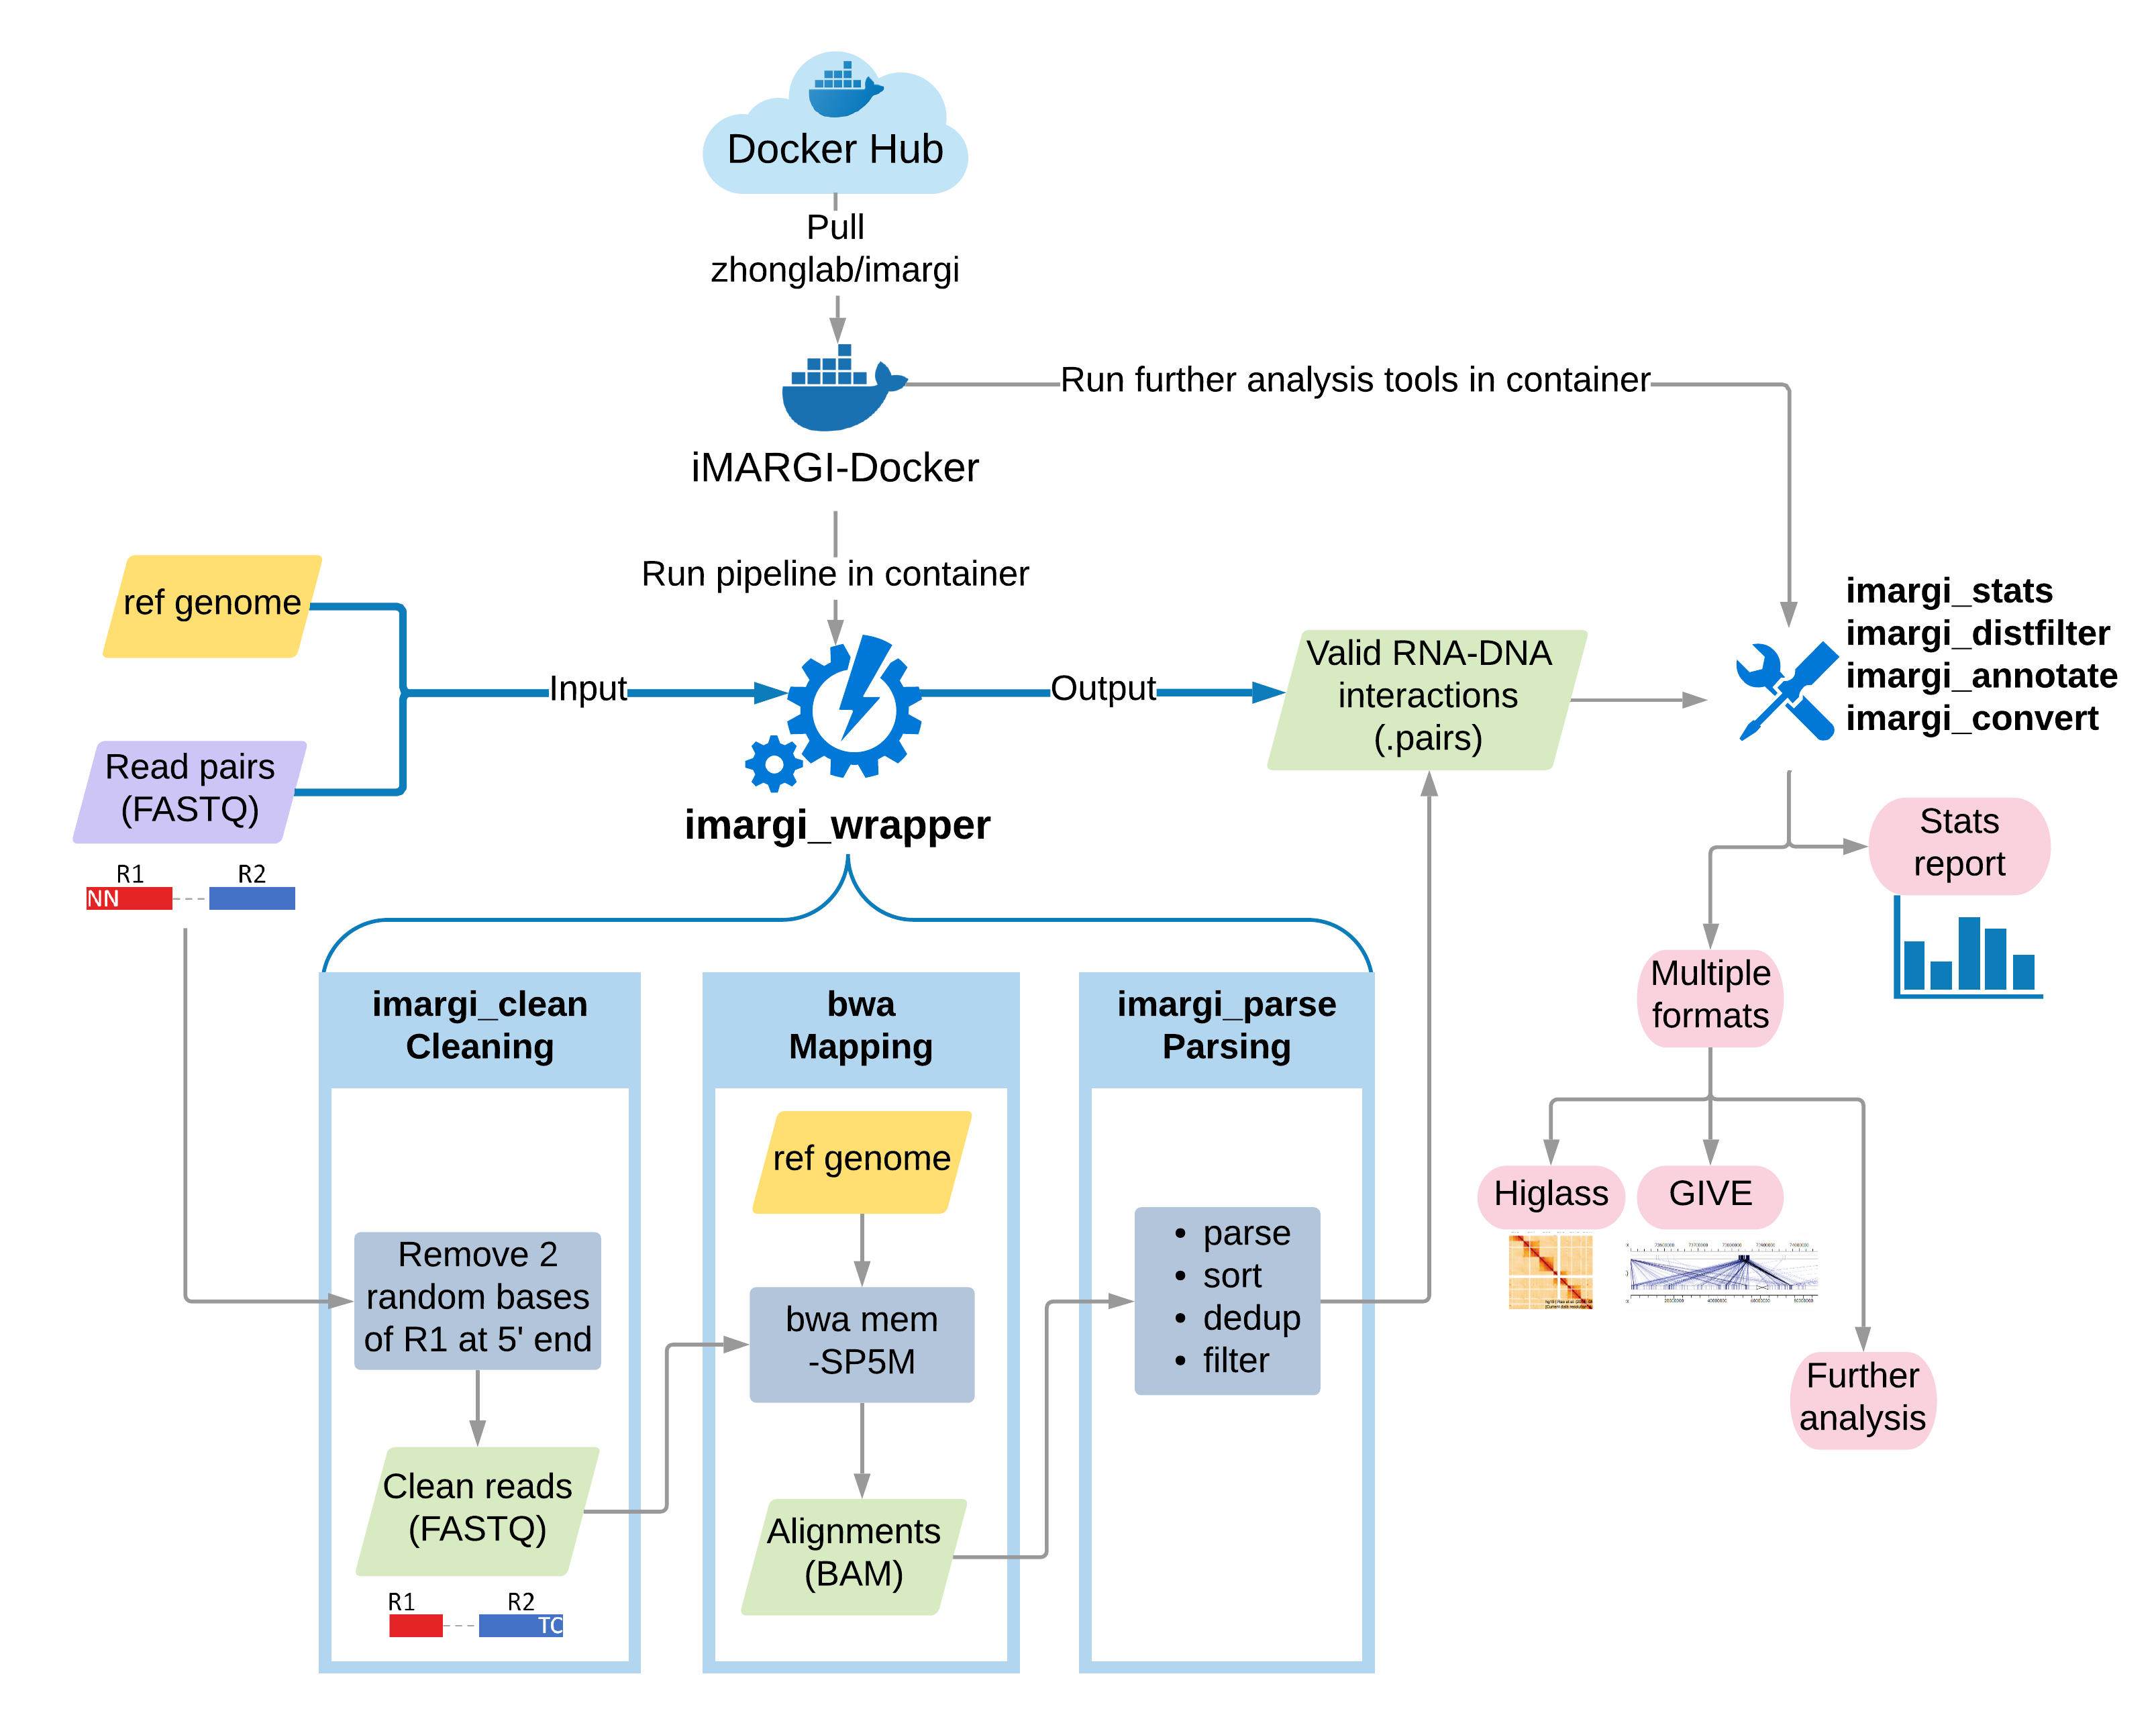
Here, we introduce the sequencing data analysis pipeline for iMARGI, which is the most critical step for computational workflow of analyzing RNA-genome interactions. The pipeline is distributed in a Docker image, iMARGI-Docker, which delivers all the iMARGI data analysis related tools, such as bwa [4] and pairtools [5]. iMARGI-Docker source code is licensed under the BSD 2 license, and the pre-built Docker image is hosted at Docker Hub.
Generally, the pipeline includes three main steps:
- Cleaning: Clean paired-end sequencing reads in FASTQ format
- Mapping: Map sequencing reads to reference genome
- Parsing: Parse and filter to get valid RNA-DNA interaction pairs from mapped read pairs
For convenience, we provide an all-in-one wrapper script imargi_wrapper.sh to automate the whole pipeline in one
command line. Users are also able to perform each step separately using its corresponding tool. In addition, we provide
several tools for preparing data for further analysis and visualization.
In this documentation, we illustrate the detail of how to use iMARGI-Docker to perform the pipeline and some instructions for further analysis and visualization.
At first, you need to install Docker CE and pull iMARGI-Docker from Docker Hub, See the Docker container usage instructions. Besides, if you are expert in Linux system configuration and you want to install all the dependencies on your own computer, you can install and configure all the required tools following the dependency tool instructions. As there are a bundle of tools need to be installed, so we strongly recommend using iMARGI-Docker.
Then a quick start example shows the simplest all-in-one command used for deciphering the RNA-DNA interaction map from a real iMARGI dataset. All the detail instructions of the actual processing steps are described in the Step-by-step Illustration section.
Besides, we also provide some instructions and tools for further analysis and visualization of RNA-DNA interaction map. The Further Analysis and Visualization Guides section gives you some guides of further investigating the RNA-DNA interaction map, including generating simple stats report, filtering by genomic distance, converting data formats, annotating RNA/DNA-ends with gene annotations and using GIVE [6] or HiGlass [7] for interactively visualizing RNA-DNA interaction map.
The Technical Notes section shows more technical information about the iMARGI-Docker image. Command-line API section lists all the usages and parameters of all the scripts.
Contents:
- Tools and Installation
- Quick Start Example
- Step-by-step Illustration
- Further Analysis and Visualization Guides
- Technical Notes
- Guides for Issues on Windows and macOS System
- Command-line API
Reference:
[1] Sridhar, B. et al. Systematic Mapping of RNA-Chromatin Interactions In Vivo. Current Biology 27, 602–609 (2017).
[2] Yan, Z. et al. Genome-wide co-localization of RNA-DNA interactions and fusion RNA pairs. PNAS February 19, 2019, 116 (8) 3328-3337. https://doi.org/10.1073/pnas.1819788116
[3] Wu, W., Yan, Z., Wen X. & Zhong, S. iMARGI: Mapping RNA-DNA interactome by sequencing.
[4] Li, H. & Durbin, R. Fast and accurate short read alignment with Burrows-Wheeler Transform. Bioinformatics, 25:1754-60. (2009).
[5] https://github.com/mirnylab/pairtools and https://pairtools.readthedocs.io/en/latest
[6] Cao, X., Yan, Z., Wu, Q., Zheng, A. & Zhong, S. GIVE: portable genome browsers for personal websites. Genome Biology 19, 92 (2018).
[7] Kerpedjiev, P. et al. HiGlass: web-based visual exploration and analysis of genome interaction maps. Genome Biology 19, 125 (2018).